|
Constructing
an Iso-irradiance Chart:
1.
A Mercury Vapour or Metal Halide Lamp
A
UVI Iso-irradiance Chart is a particularly useful tool for
visualising the extent of the UV coverage of a lamp. This
chart is useful as it enables predictions to be made of
the UV levels which various basking platforms, etc, will
receive in a vivarium and therefore it can be used to help
choose the right lamp for a given species in a particular
vivarium or enclosure.
To
map the UV gradient, it is necessary to record the output
of the lamp in a two-dimensional plane directly beneath
and to the sides of the lamp face (Fig.2). Direct readings
are taken from several hundred points in this plane, and
plotted on a chart so that a two-dimensional visualisation
of the three-dimensional “cone” of radiation emitted by
the lamp can be visualised.
 Preparing
to map the UV gradient Preparing
to map the UV gradient
It
is easiest to work beneath a bright lamp, since the
light does not shine directly into your eyes. You will need
to hang the lamp a short distance from a wall (8 - 10 inches
away should prove satisfactory).
The
beam of UV from a hanging mercury vapour or metal halide
lamp may extend a considerable distance beneath the lamp.
If direct recordings have already been taken from below
the lamp, you will already have a clear idea of how far
below the lamp the useful beam extends. Angling the meter
towards the lamp from the side will give you a rough idea
of how wide the beam will be. Fasten a suitably large sheet
of non-reflective paper or card to the wall - you will be
plotting the full-size chart onto this. If the lamp is very
powerful (such as a lamp for zoos) the chart may be so large
that you might consider drawing straight onto the wall.
Use a water-soluble pencil in this case!
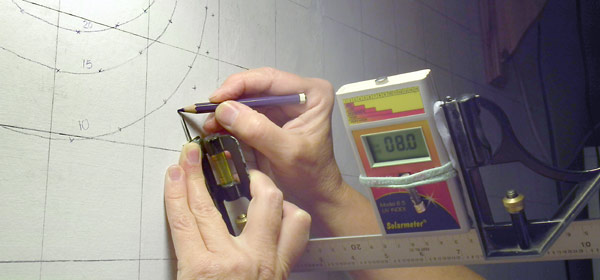
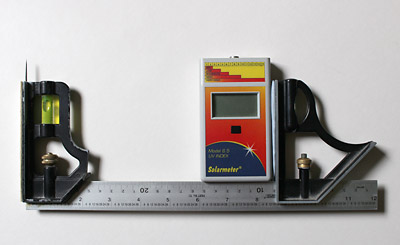 The
most difficult part of this enterprise is ensuring that
the UVI meter is kept in the same plane throughout the recording
session. The easiest way to do this is to tape or blue-tack
the meter to a set square or spirit level rule, which is
then held against the wall. A pointer of some sort may be
affixed to the other end of the set square or rule, such
that its tip corresponds to
the relative position of the meter sensor. (see Figs. 1,
2 and 3.) The
most difficult part of this enterprise is ensuring that
the UVI meter is kept in the same plane throughout the recording
session. The easiest way to do this is to tape or blue-tack
the meter to a set square or spirit level rule, which is
then held against the wall. A pointer of some sort may be
affixed to the other end of the set square or rule, such
that its tip corresponds to
the relative position of the meter sensor. (see Figs. 1,
2 and 3.)
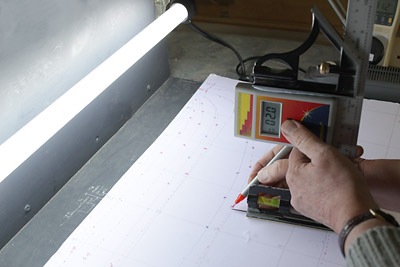
Plotting
the Iso-irradiance Contours
You
are now going to take readings from the meter, angled so
that it is aiming directly at the lamp surface (direct readings)
whilst keeping the meter exactly the same distance from
the wall – so all your readings are in the same vertical
plane as the wall..it is then a fair cross section of the
lamp’s output. You are going to plot the UVI "contours"
- the furthest points at which given outputs (eg. UVI 0.5,
1, 2, 4, 6 and so on) are found.
To
detect the UVI contours, move the meter back and forth,
tipping it gently to scan for the furthest distance from
the lamp at which it is possible to record the output you
are working on. Use the rule to transfer your data to the
card on the wall, by marking each reading at the corresponding
point on the card and then "joining up the dots"
(see Figs. 1 and 2.)
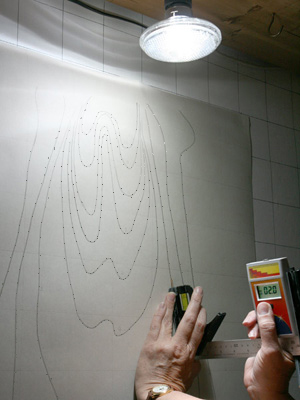 Fig.
1 shows a chart being plotted for a mercury vapour lamp;
the readings are being taken for the UVI 8.0 contour. Fig.
4 shows a completed chart for a metal halide lamp; the meter
is being held on the UVI 2.0 contour. If you find it difficult
to hold the meter against the wall while pressing the meter
button and simultaneously marking the points with the pencil,
you can keep the button on the meter permanently depressed
by placing a coin (or other small object) over it and wrapping
a rubber band around the meter to hold the coin down. Fig.
1 shows a chart being plotted for a mercury vapour lamp;
the readings are being taken for the UVI 8.0 contour. Fig.
4 shows a completed chart for a metal halide lamp; the meter
is being held on the UVI 2.0 contour. If you find it difficult
to hold the meter against the wall while pressing the meter
button and simultaneously marking the points with the pencil,
you can keep the button on the meter permanently depressed
by placing a coin (or other small object) over it and wrapping
a rubber band around the meter to hold the coin down.
All
the iso-irradiance charts in the reports featured on this
website were constructed in this way. From this full size
chart, a scale diagram may be prepared, if required.
Completing
the chart for inclusion in a report
If
the chart is small enough, and drawn onto card or paper,
it may be scanned, in sections, into an image-editing program.
If it is too large, or drawn onto a wall, then the easiest
way to transfer the data to the computer is to produce an
accurate, scaled-down copy of the whole chart on a sheet
of graph paper, which can then be scanned into an image-editing
program.
Most
editing programs which utilise layer technology would be
suitable; I use Photoshop. I first draw out the grid, then
trace the contours - for this, the Photoshop "paths"
tools make life easier.
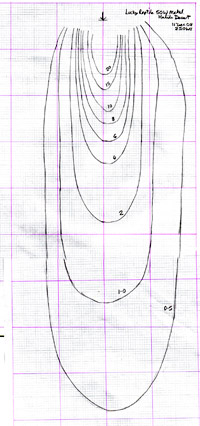
Fig.
5 (below) shows
a typical example of the original scale drawing of an iso-irradiance
chart at completion. Fig. 6 shows the finished chart.
The
final result can also be converted into a useful visualisation
of the UV gradient of the lamp in question by over-laying
it onto a diagram of a vivarium.
|


 Iso-irradiance
charts for most fluorescent tubes and compact lamps are
smaller, since the UV output is usually relatively low.
In most cases, the chart may be plotted on a single A1-size
sheet of paper or card. This is placed on a table or test
bench to which the lamp is mounted, either horizontally
or vertically depending upon the desired orientation of
the chart. The principle is exactly the same as for the
mercury vapour lamp.
Iso-irradiance
charts for most fluorescent tubes and compact lamps are
smaller, since the UV output is usually relatively low.
In most cases, the chart may be plotted on a single A1-size
sheet of paper or card. This is placed on a table or test
bench to which the lamp is mounted, either horizontally
or vertically depending upon the desired orientation of
the chart. The principle is exactly the same as for the
mercury vapour lamp.